Epoch 8 Report

Analysis of Epoch 8 metrics and user behavior

Summary

0. Locks and Unlocks

Monthly Transactions

Monthly Transactions

Weekly Transactions

Weekly Transactions

1. Users

(1.1) Epoch Turnout

Epoch Turnout

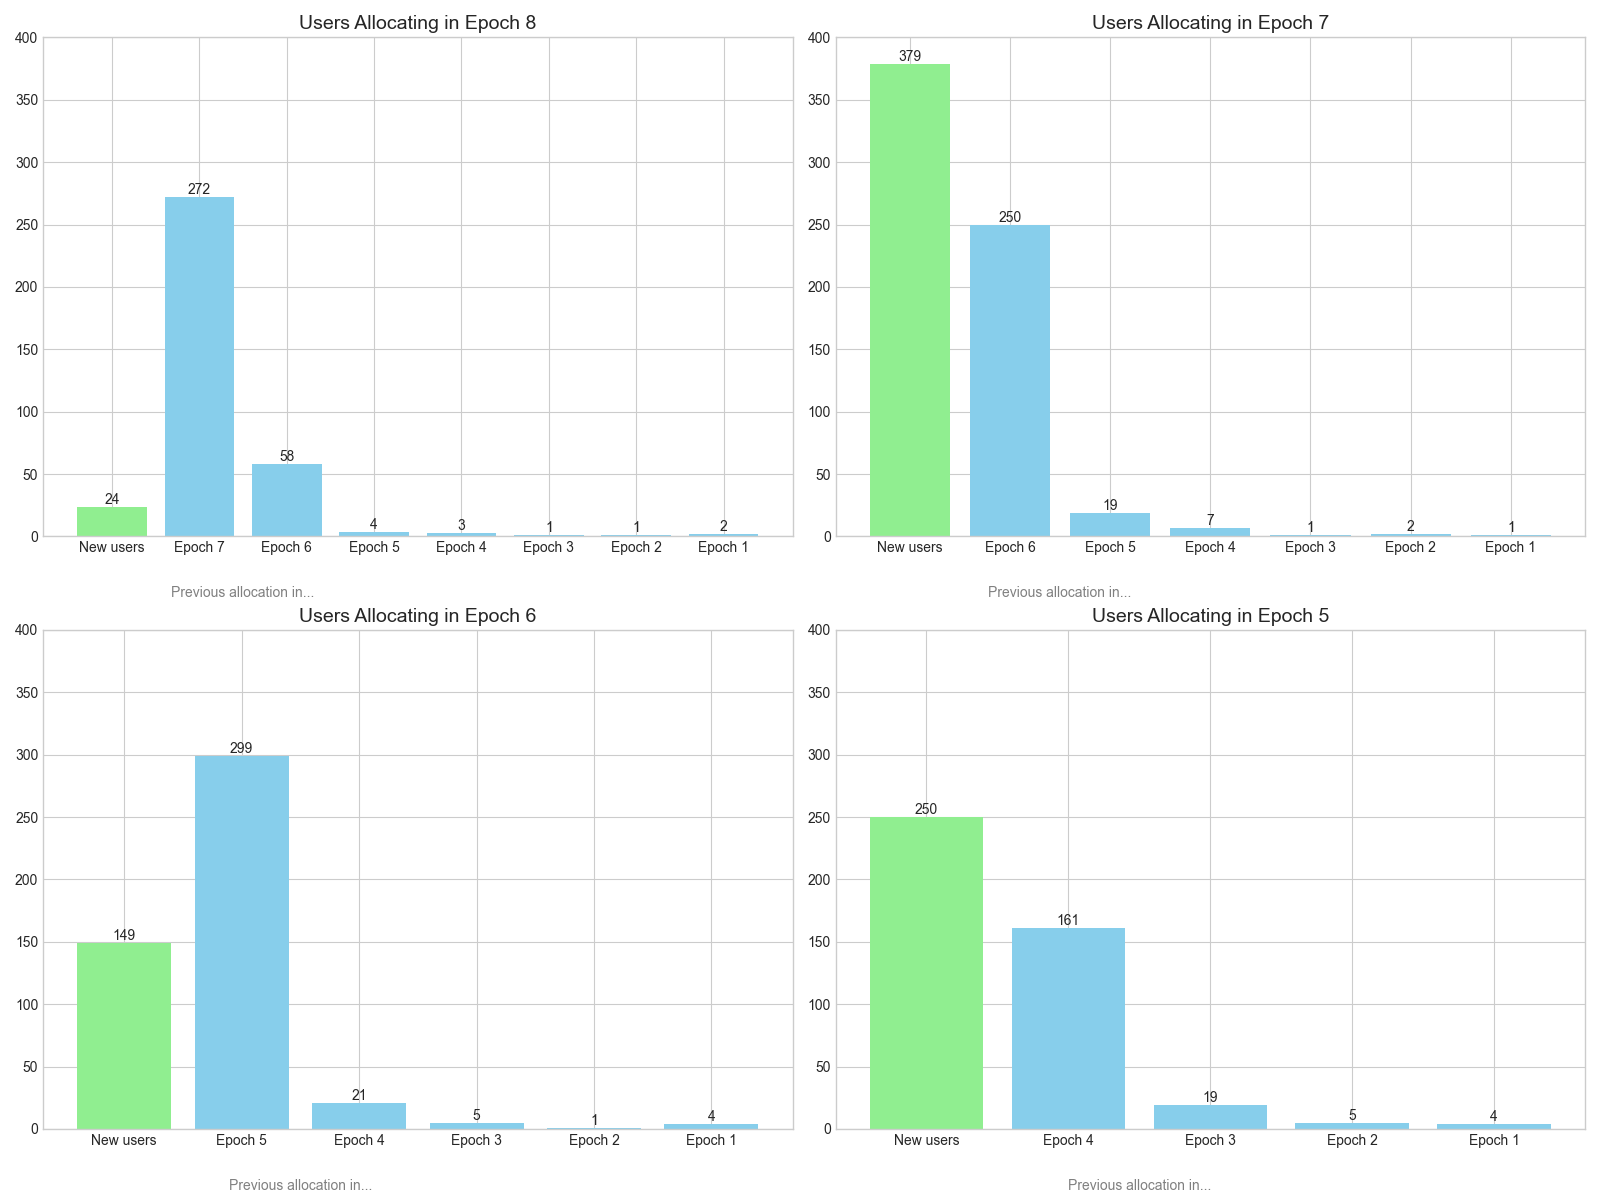
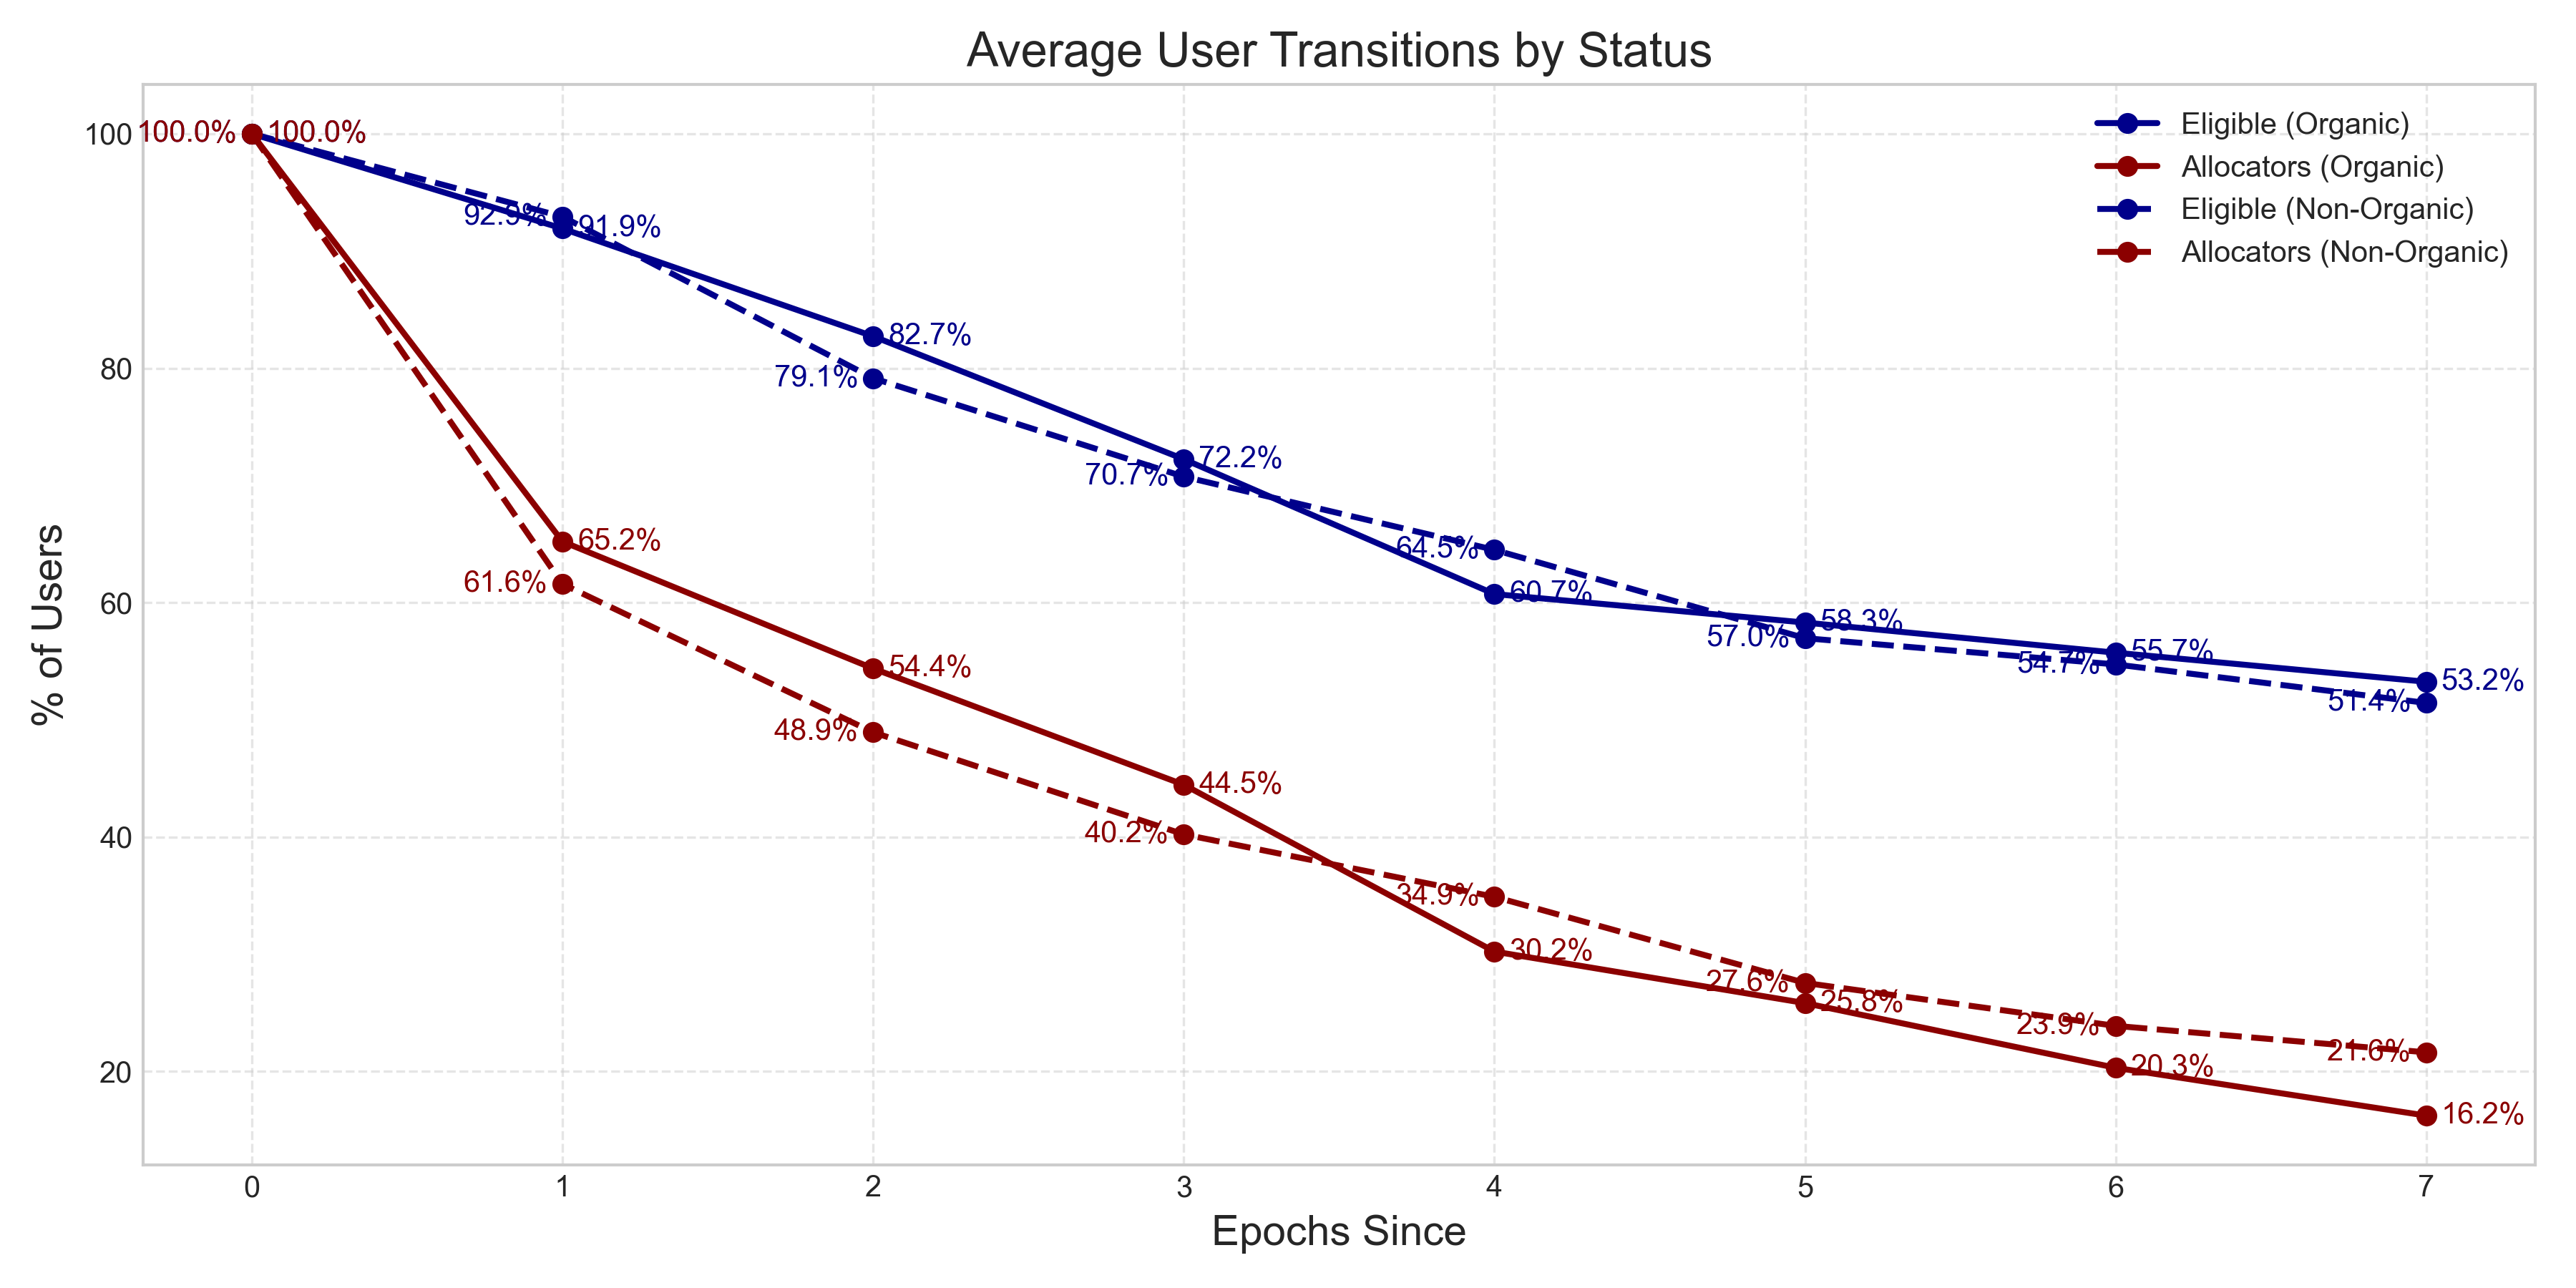
Eligibility in Epoch 8 fell steeply after we cancelled more than 500 streams: E7 marketing participants hadn’t allocated during the E7 AW, triggering the cancellation rule. Since we skipped onboarding efforts in Epoch 8, the only fresh entrants were 24 organically acquired users who locked GLM. Altogether, 365 addresses submitted allocations, nudging us toward the engagement levels seen in Epochs 1-4. Voter turnout reached 28 % of those eligible.

(1.2) Epoch Progress

Epoch Progress

Although Epoch 8 followed nearly the same relative path as Epoch 7, its absolute figures were lower across the board. We began briskly on day 1 and recorded an especially high count of first allocations on day 14.**

(1.3) Allocation Timing

Epoch Turnout

The hourly allocation pattern matched earlier epochs, with most decisions submitted during the UTC afternoon and early evening.

(1.4) Cohorts

Daily New Users

We see two key patterns in the cohort data. First, organic users (GLM lockers and allocators who never received handouts) remain stable from one epoch to the next, especially after adjusting for possible sybils. A decline in participation from epoch to epoch is compensated by small, but not non-existent organic growth. Second, participation from marketing-onboarded users is falling. The decline is moderate for Epoch 5 campaigns but sharp for the Epoch 7 campaigns, particularly in the SheFi community. By the end of Epoch 8 only 74 of those users were active, down from nearly 900 initial streams - an 8 % retention rate.

If these trends hold, Epoch 9 should see around 250 participants.

(1.5) User History

User History

Epoch 8 stands out for two reasons. First, there were no marketing campaigns during this period, so new-user growth was entirely organic. Second, roughly 15% of allocators had joined Epoch 6 but skipped Epoch 7—evidence that the climate round didn’t resonate strongly with our user base. In the other epochs, that share was only 2 %–4 %.

(1.6) Transitions of Allocators

Transitions of Allocators

This chart tracks Octant users who made an allocation in a given epoch. After one epoch, 92 % still have GLM locked, yet only 63.2 % participate in the next allocation window. At two epochs the figures fall to 80.4 % and 51.2 %, and by seven epochs to 52.2 % and 19.3 %, respectively. Averages are plotted with thin lines; note that we have seven data points for the one-epoch interval but only one for the seven-epoch interval.

(1.7) Transitions vs Cohorts

Transitions of Allocators

The second chart, which plots cohort averages, shows comparable transition patterns for organic users and those acquired through marketing. The slight divergence—organic users are more active early and less active later—stems from the Sybil purge after Epoch 4, where many affected accounts were labelled organic.

(1.8) Dead or Alive?

Daily New Users

Users from Epoch 8 can be assinged into three groups: 1) 28 % allocated funds in Epoch 8; 2) 27 % last allocated in Epoch 7 and skipped Epoch 8, with a slim chance of returning in Epoch 9; 3) 44 % last allocated in Epoch 6, earlier or never (effectively inactive).

(1.9) Allocation Changes

Allocation Changes

The frequency of allocation changes has returned to pre-Epoch 7 levels.

(1.10) Distribution of Donations

Distribution of Donations

Total donations reached 14.15 ETH in Epoch 9, nearly 10 ETH more than Epoch 7, thanks to a markedly higher donation-to-budget ratio in the L—and especially XL—categories. Apparently, our largest lockers found the Ethereum-focused round (Epoch 8) far more engaging than the climate round (Epoch 7).

Categories

(1.11) Donors

Projects Supported

For users who participated in the allocation window, donor participation rebounded from Epoch 7 levels—another sign that Epoch 8 resonated better with the active portion of our user base.

2. Funding Distribution & Voters' Agenda

(2.1) QF vs Linear Distribution

QF vs Linear Distribution

In the top 20 there is virtually no correlation between total donation amount and MF-QF distribution - the biggest QF vs linear difference so far. In previous epochs, the linear model’s threshold was the main driver of any gap.

(2.2) Correlations

Correlations

Again, what determined the outcomes of this epoch was the number of donors, not the total amount of donations.

(2.3) Projects Supported

Projects Supported

Epoch 8 saw the average number of projects each user backed rise to 5.2 from 3.8, reversing the decline we’d tracked since Epoch 3.

(2.4) Correlations

Correlations

Not necessarily a sign of collusion, but there were some interesting correlations in where users directed their donations: 1) EAS <–> Protocol Guild and Orbit DB (core Ethereum cluster), 2) L2Beat <–> GrowThePie and DeFi Llama (dashboard cluster)

(2.5) Single-project Votes

Single-project Votes

GrowThePie stands out as the project which mobilised the biggest number of single-agenda allocators.

3. Octant Aggregates

Amounts (ETH)

epoch budget budget_allocated donations leftover (%) progress (%) generosity (%)
1 101.469 75.913 5.527 25.2 74.8 7.3
2 138.233 137.941 3.925 0.2 99.8 2.8
3 241.301 239.465 25.484 0.8 99.2 10.6
4 214.744 203.187 4.788 5.4 94.6 2.4
5 220.261 205.297 17.630 6.8 93.2 8.6
6 197.785 195.760 14.313 1.0 99.0 7.3
7 211.906 208.407 4.526 1.7 98.3 2.2
8 198.618 184.432 14.048 7.1 92.9 7.6
9 173.609 113.015 0.813 34.9 65.1 0.7

Note: patron mode not included.

Users (addresses)

epoch potential_users allocators donors turnout (%)
1 515 362 347 70.3
2 586 366 332 62.5
3 603 320 285 53.1
4 593 303 279 51.1
5 898 439 422 48.9
6 982 479 455 48.8
7 2162 659 586 30.5
8 1296 365 336 28.2
9 1034 50 43 4.8

Note: patron mode not included.

Cohorts

epoch ga_beneficiaries ga_e6_beneficiaries ga_celo_beneficiaries ga_shefi_beneficiaries ga_raffle_beneficiaries
1 15 1 2 0 6
2 14 1 3 0 6
3 15 2 5 0 6
4 16 2 4 0 7
5 232 20 4 4 18
6 193 29 7 3 18
7 116 19 41 278 19
8 78 14 19 78 20
9 10 4 3 1 7