Epoch 7 Report

Analysis of Epoch 7 metrics and user behavior

Summary

0. Locks and Unlocks

Monthly Transactions

Monthly Transactions

Weekly Transactions

Weekly Transactions

1. Users

(1.1) Epoch Turnout

Epoch Turnout

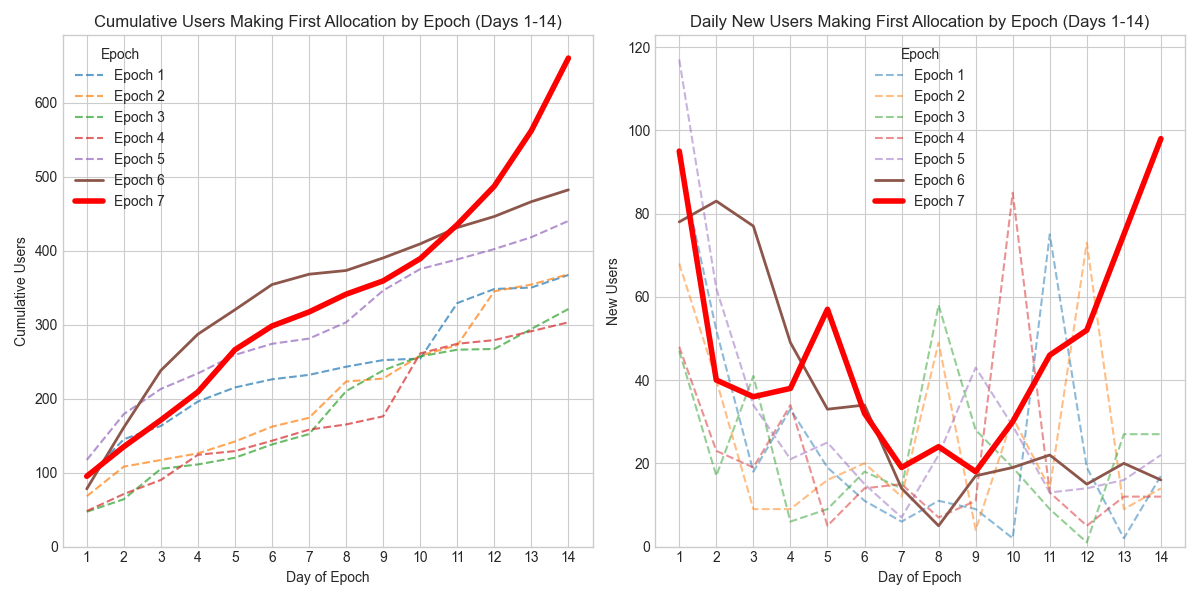
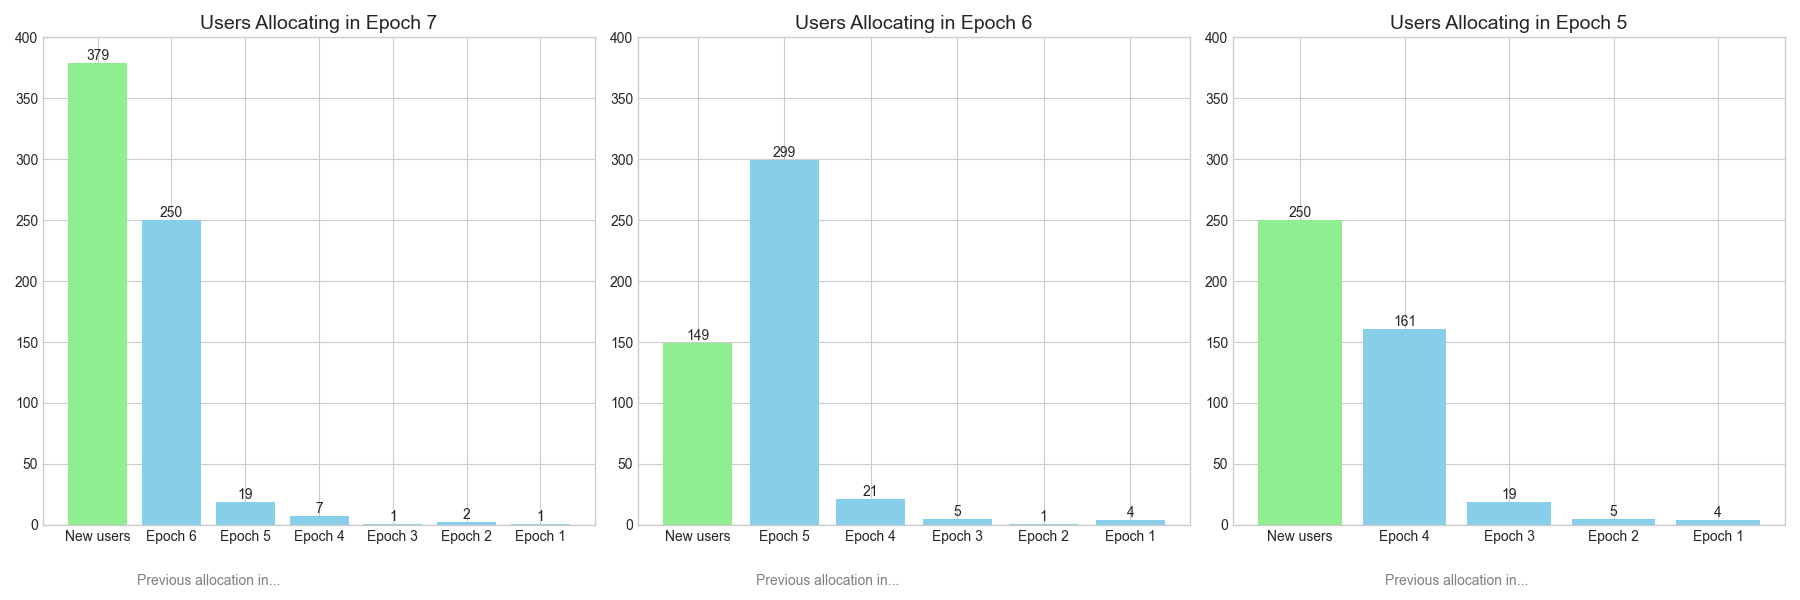
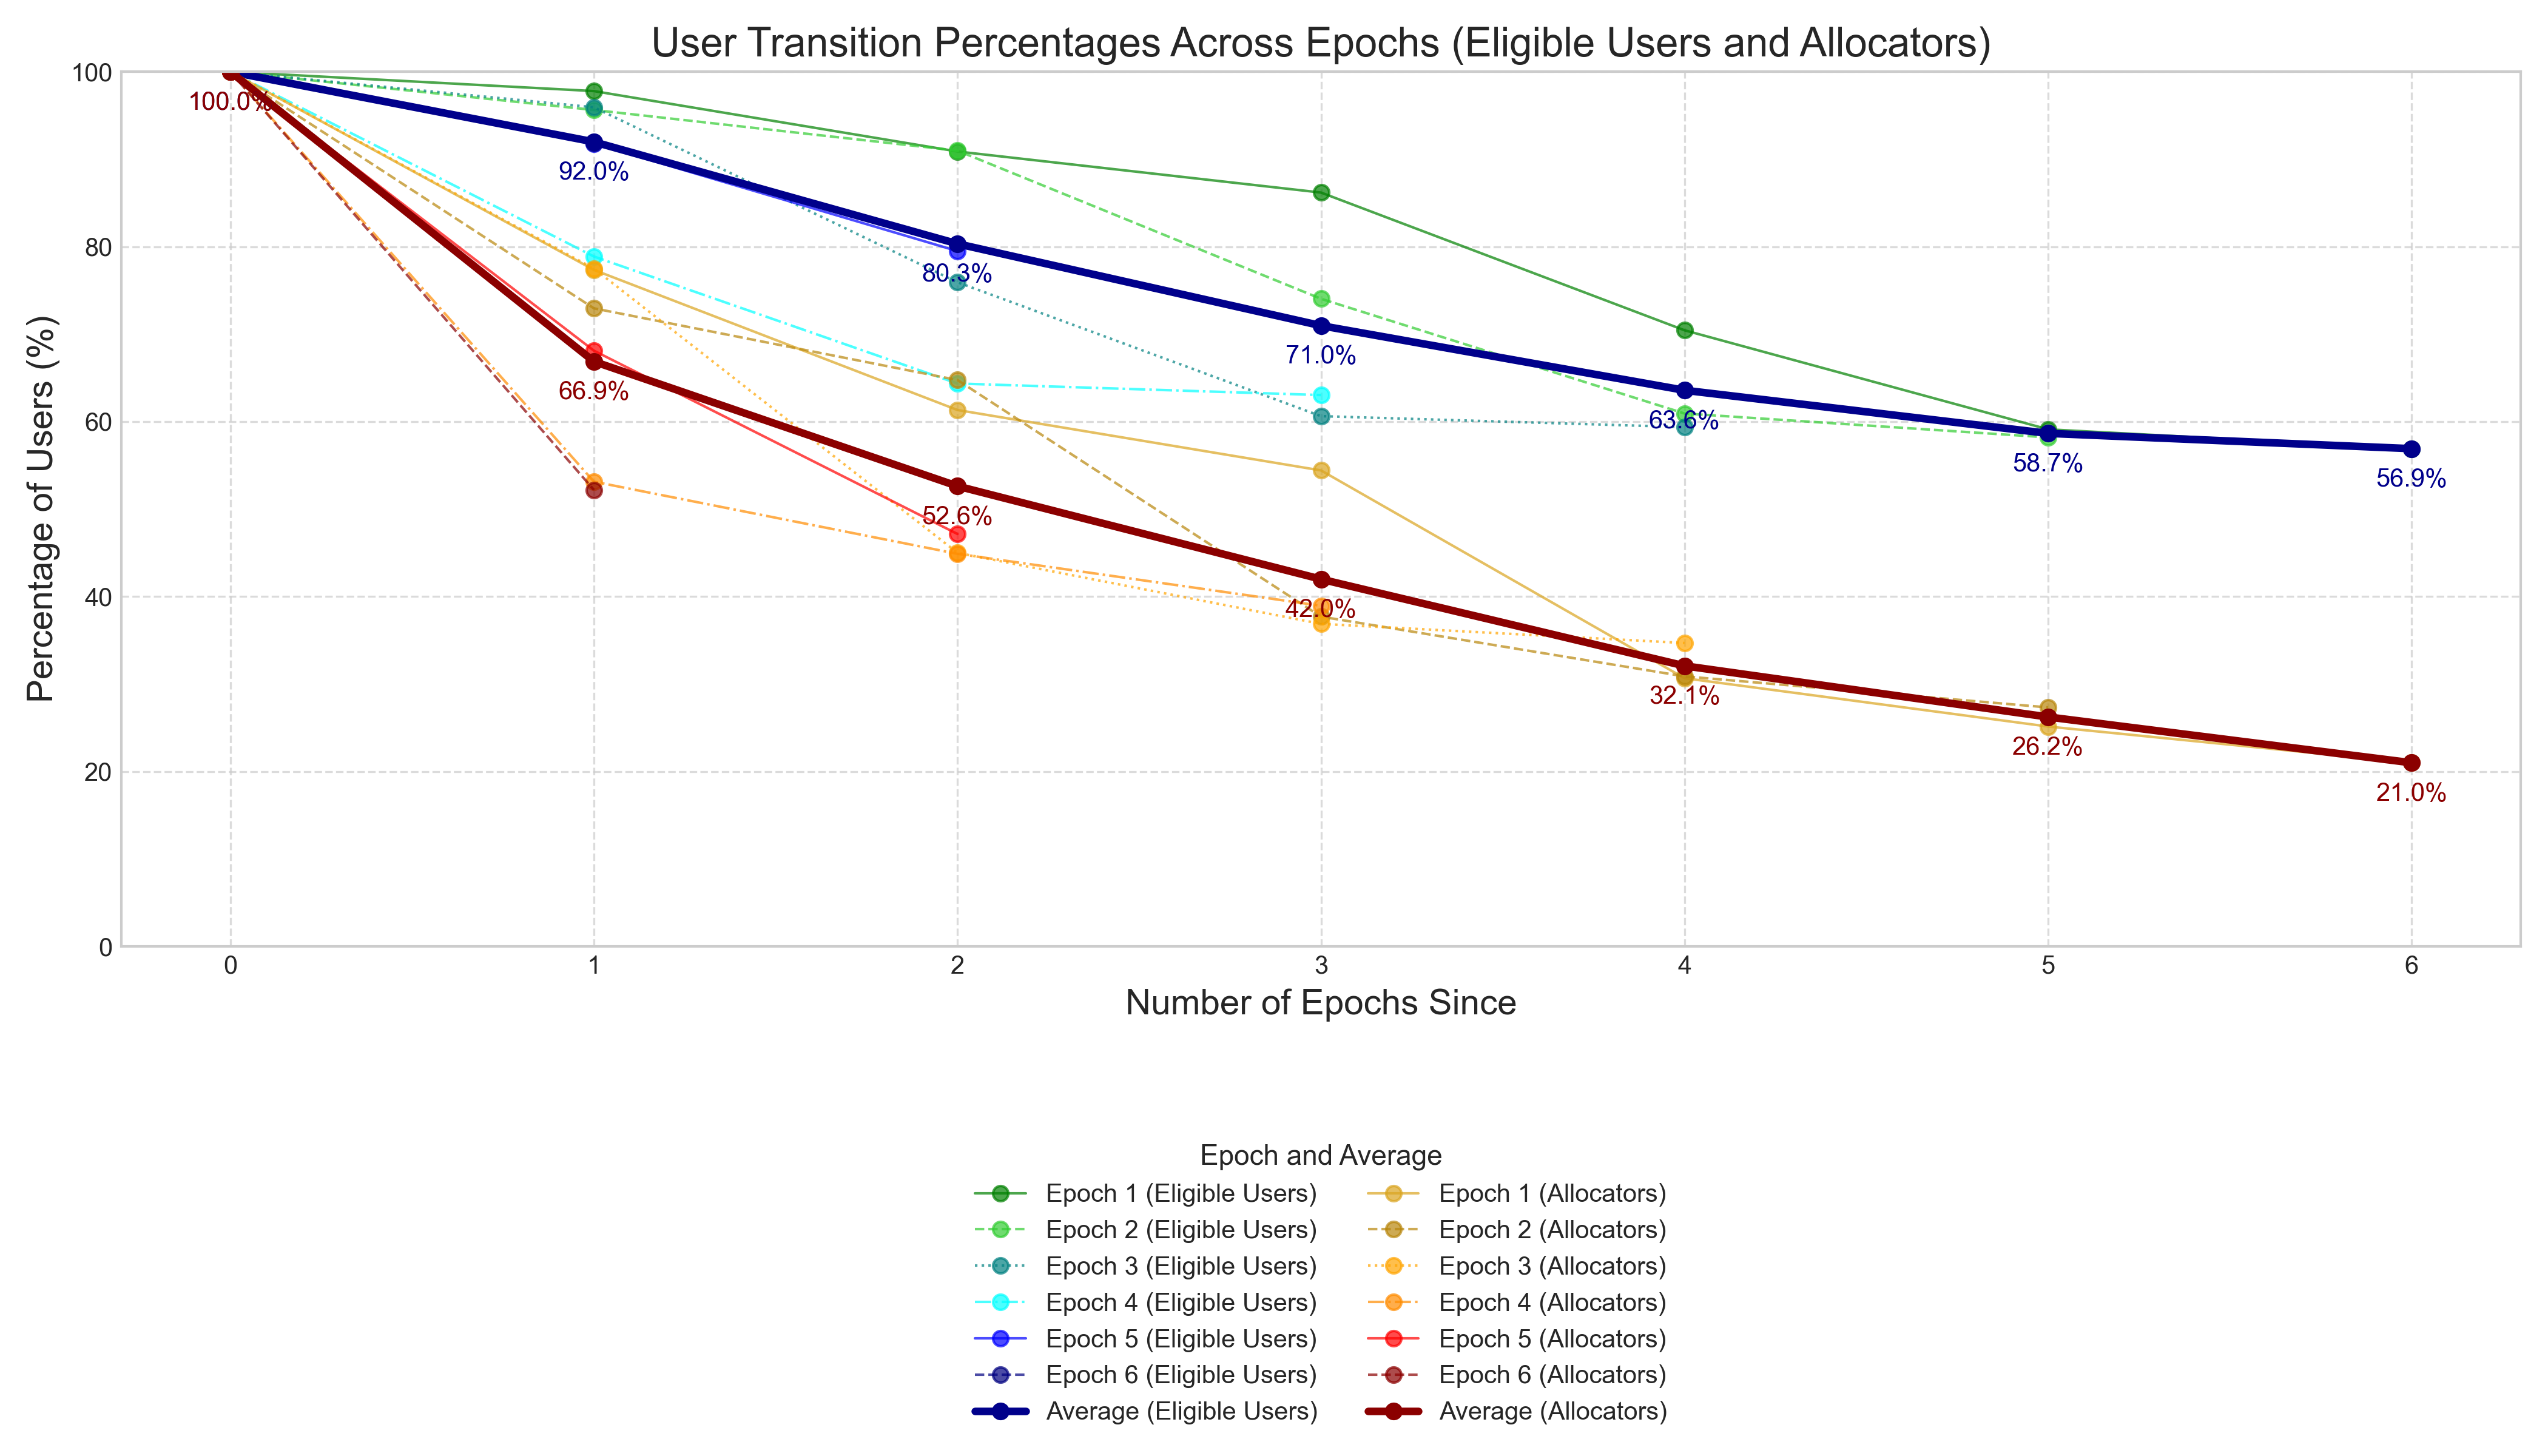
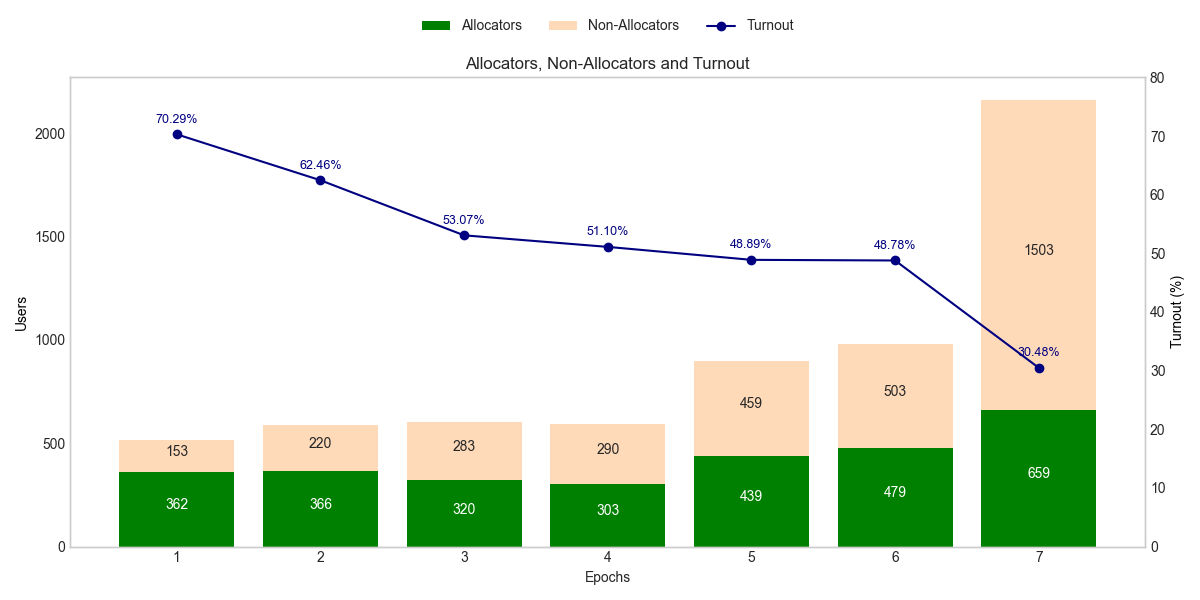
In Epoch 7, we hit a record-high 659 users participating in the allocation window (up from 496 in Epoch 6). On the flip side, only 26% of eligible users showed up — the lowest relative turnout we’ve ever seen. The main contributing factors are low engagement from the freshly onboarded SheFi and Celo communities, plus a big drop-off among users who did allocate in Epoch 6.

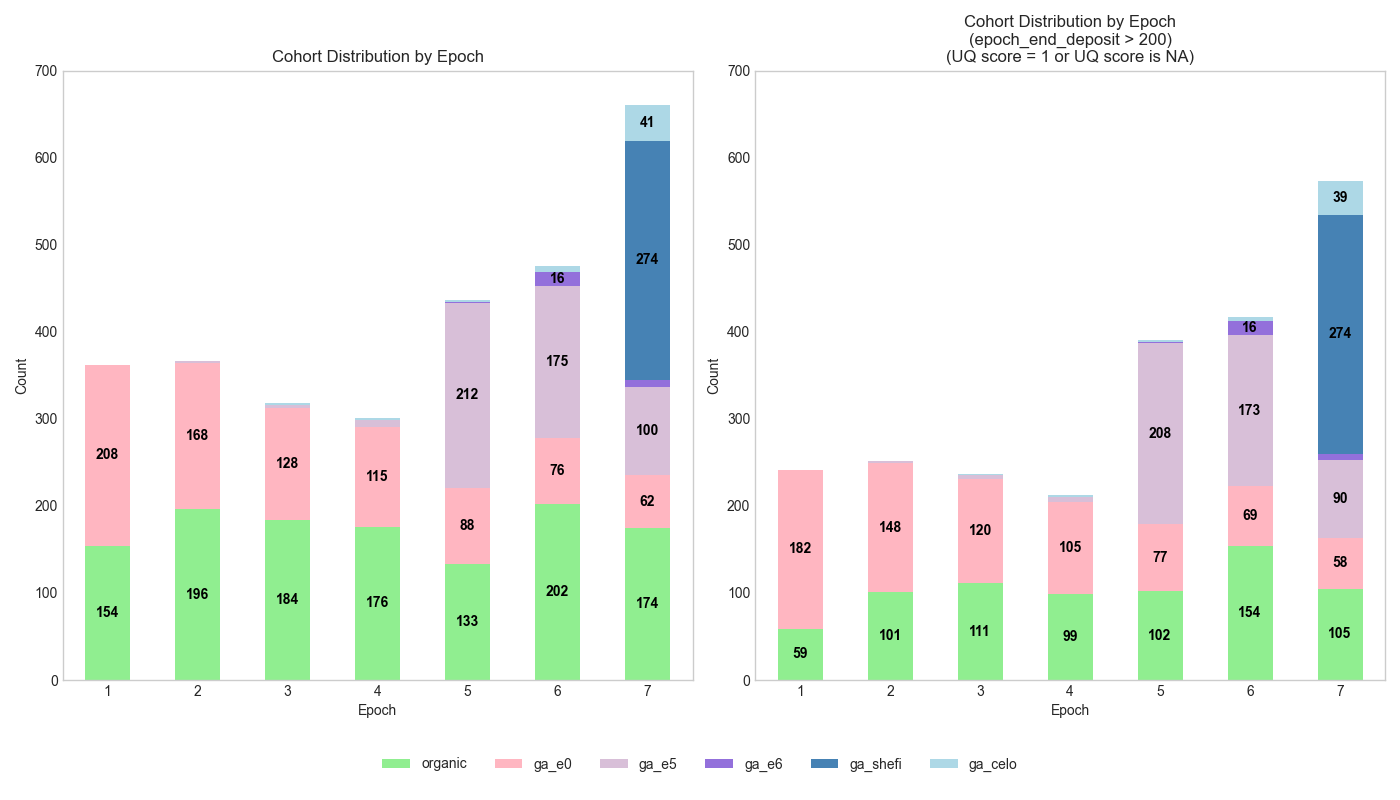
Out of 868 eligible SheFi users, only 278 participated (32%), meaning 590 streams will be canceled. For Celo, participation was worse: 41 out of 270 (15%), so 229 cancellations there. In total, we’re scrapping 819 streams. Barring any major locks or unlocks during Epoch 8, we’re looking at around 1,300 addresses eligible for the next allocation window.

(1.2) Epoch Progress

Epoch Progress

In Epochs 1–6, most allocations happened within the first 2–3 days of the window, with a few anomalies caused by lower weekend activity and sybil spikes in Epochs 1–4. Epoch 7 broke the pattern: it had a sluggish start but an unprecedented surge in the second week — nearly 100 users made their first allocation in the final 24 hours alone.

(1.3) Allocation Timing

Epoch Turnout

Allocation timing followed the usual daily rhythm: lowest activity between 3–9 AM UTC, and a strong peak between 3–9 PM UTC (almost 40% of allocations happened during that window).

(1.4) Cohorts

Daily New Users

The SheFi cohort was by far the largest group among our users. Meanwhile, the cohort that shrank the most since Epoch 6 was the group of Epoch 5 giveaway beneficiaries.

The left chart shows all addresses participating in the allocation window. The right chart filters out addresses with a UQ score below the threshold and those with less than 200 GLM deposited at epoch-end (there’s still a fair amount of suspicious accounts here, even if their UQ scores look decent). Bottom line: we estimate the real size of our user base at a max of 570 users — with 103 organic users, meaning addresses that didn’t get any funding through our marketing campaigns.

(1.5) Allocation Changes

Allocation Changes

After we introduced quadratic funding in Epoch 4, Octant users had way fewer incentives to tweak their allocations mid-window — no funding threshold, and a single user’s impact was much smaller. As a result, the average number of allocations per user dropped from around 1.6 in Epochs 1–3 to 1.3–1.4 in Epochs 4–6. In Epoch 7, though, it’s back above 1.6, with over a third of users changing their allocation at least once during the window.

(1.6) Distribution of Donations

Distribution of Donations

Total donations in Epoch 7 were just 4.53 ETH — the lowest since we introduced PPF. The almost 10 ETH drop vs Epoch 6 was mostly due to our biggest whale-donor claiming their entire reward and allocating zero to projects, unlike in earlier epochs. Beyond that, the donation-to-budget ratio dropped across every user-size category, with the steepest fall in the sub-500 GLM group (from 92% to 66%). Meanwhile, the long-running slide in the 10k–200k GLM bracket continued too (65% in Epoch 4 down to 34% in Epoch 7).

Categories

(1.7) User Types

User Types

The share of users not allocating anything was high across the board in Epoch 7, especially brutal in the sub-500 GLM group — almost three-quarters didn’t even show up. What’s new is a sudden rise of sub-500 GLM users who did allocate but then claimed the full reward anyway: only 3 such cases in Epoch 6, but 69 in Epoch 7. Until now, this behavior was basically reserved for the big lockers.

Categories

(1.8) Donors

Projects Supported

The share of users donating at least something dropped by 7 percentage points compared to Epoch 6. The lowest donation rates came from the organic users (i.e. no marketing campaign connection) and the SheFi cohort.

(1.9) Projects Supported

Projects Supported

Since Epoch 4 (aka the quadratic funding era), we’ve been watching the average number of projects supported per user slide lower — and in Epoch 7 it finally dipped below 4 for the first time. Part of it is simple: fewer projects to pick from (20 instead of 30), and most users weren’t familiar with the new set of beneficiaries. Still, a couple of fun facts: 18 users split their rewards across all 20 projects — something we’ve never seen at this scale before. On the flip side, 179 users backed only a single project.

2. Funding Distribution

(2.1) QF vs Linear Distribution

QF vs Linear Distribution

The quadratic distribution of MF in Epoch 7 turned out pretty interesting. Unlike previous epochs, it didn’t cause any major reshuffling in the ranking of beneficiaries compared to a hypothetical linear distribution. As usual, it smoothed things out: the long tail of less popular projects still snagged a piece of the matching pie (in contrast, the linear model assumes a 1/n threshold, as we had until Epoch 3).

(2.2) Correlations

Correlations

Generally, projects that pulled in the most total donations were also backed by the highest number of users — another reason why the quadratic and hypothetical linear outcomes ended up looking pretty similar this time.

3. User Flows

(3.1) User History

User History

Most of the users active in the Epoch 7 allocation window were first-timers at Octant, mainly from the SheFi and Celo cohorts. Same story as before: very few users returned after going inactive in the previous epoch (Epoch 6 in this case). What will be really interesting to watch in Epoch 8 is whether the Epoch 6 allocators who skipped Epoch 7 (probably because the climate focus didn’t excite them) come back for an Ethereum-specific round.

(3.2) Transitions of Allocators

Transitions of Allocators

This chart tracks the engagement of Octant users who made an allocation in a given epoch. On average, after one epoch, 92% of users still have their GLM locked, but only 66.9% participate in the next allocation window. After two epochs, 80.3% still have GLM locked, but participation drops to 52.6%. Fast-forward six epochs: only 56.9% still have any GLM locked, and just 21.0% show up for allocations. Note: This is based on averages for each epoch (thin line charts). We have six observations for the first interval (1 epoch passed) and only one for the sixth interval.

The chart also highlights how unique Epoch 7 was for Epoch 6 allocators — 48% of them skipped the Epoch 7 allocation window, the biggest drop we’ve seen so far. We had a similar drop-off between Epochs 3 and 4, but that was mostly due to sybil addresses leaving after QF was introduced. This time, it’s more likely because of the climate-themed round not appealing to the broader user base.

(3.3) Transitions vs Cohorts

Transitions of Allocators

This next chart (averages only) shows that user transition behavior between epochs is pretty similar between the organic cohort and those funded through marketing campaigns. The slight difference — with organic users being more active early on and less active later — is again explained by the sybil purge after Epoch 4, since many of those accounts had been tagged as organic.

(3.4) Raffle Users

Transitions of Allocators

So far, over 20 users have received GLM through the Octant Raffle (during Epochs 6 and 7). The evidence on the Raffle’s impact is mixed. On the plus side (left chart), this group donates a much bigger chunk of their rewards compared to other users with similar GLM lock sizes — even after winning the Raffle. On the flip side, there’s zero sign that they’re locking any new GLM (right chart).

4. Voters' Agenda

(4.1) Correlations

Correlations

With most projects being new faces to Octant users, people were also a lot less opinionated this time about who should get their donations. As a result, there were no strong vote correlations between projects — with one exception: a pretty noticeable overlap between votes for Atlantis and GainForest. Definitely something worth digging into.

(4.2) Single-project Votes

Single-project Votes

Because none of the projects had strong ties to the Octant user base (unlike previous epochs where loyalties ran deep), single-project allocations were way less common this time, especially compared to Epoch 6.

5. Octant Aggregates

Amounts (ETH)

epoch budget budget_allocated donations leftover (%) progress (%) generosity (%)
1 101.469 75.913 5.527 25.2 74.8 7.3
2 138.233 137.941 3.925 0.2 99.8 2.8
3 241.301 239.465 25.484 0.8 99.2 10.6
4 214.744 203.187 4.788 5.4 94.6 2.4
5 220.261 205.297 17.630 6.8 93.2 8.6
6 197.785 195.760 14.313 1.0 99.0 7.3
7 211.906 208.407 4.526 1.7 98.3 2.2

Note: patron mode not included.

Users (addresses)

epoch potential_users allocators donors turnout (%)
1 515 362 347 70.3
2 586 366 332 62.5
3 603 320 285 53.1
4 593 303 279 51.1
5 898 439 422 48.9
6 982 479 455 48.8
7 2162 659 586 30.5

Note: patron mode not included.

Cohorts

epoch ga_beneficiaries ga_e6_beneficiaries ga_celo_beneficiaries ga_shefi_beneficiaries ga_raffle_beneficiaries
1 15 1 2 0 6
2 14 1 3 0 6
3 15 2 5 0 6
4 16 2 4 0 7
5 232 20 4 4 18
6 193 29 7 3 18
7 116 19 41 278 19